timer_t class and use it to measure the
execution time of the sorting algorithm, bubblesort.
timer_t class should have design prototype:
class timer_t {
  public:
  // constructors
  timer_t();

  // member functions
  void start(void);
  void stop(void);

  double elapsed_us();
  double elapsed_ms();
  double elapsed_s();

  private:
  double	ts;
  double	te;
  double	tt;
};
start() and stop() methods simply capture
timestamps and eslapsed_s() then calculates and returns
the elapsed time between the two timestamps in secionds (the
other two return the time elapsed in milliseconds and microseconds).
gettimeofday() to obtain a
timestamp of the current time, in seconds and microseconds
since "the epoch" (January 1, 1970).
#include <sys/time.h>
timer_t class to measure the execution time of the
sorting routine, bubblesort,
void bubblesort(int A[])
{
  for(int i=1; i<SIZE; i++)
    for(int j=SIZE-1; j>=i; j--)
      if(A[j-1]>A[j])
        swap(A[j-1],A[j]);
}
array_t class to store random integer values, e.g.,
#include "array.h"

	array_t<int>	A(atoi(argv[1]));

  A.randseed();
  A.randfill();
bubblesort()
for the array_t class:
- redefine the above sort function so that it operates on
the array stored by
array_t - replace
SIZEwith the array's size
main() routine should then include:
int main()
{
  // read in desired array size
  // declare array variable A
  ...
  // start the timer
  A.bubblesort();
  // stop the timer
  // report the timer value
}
- a
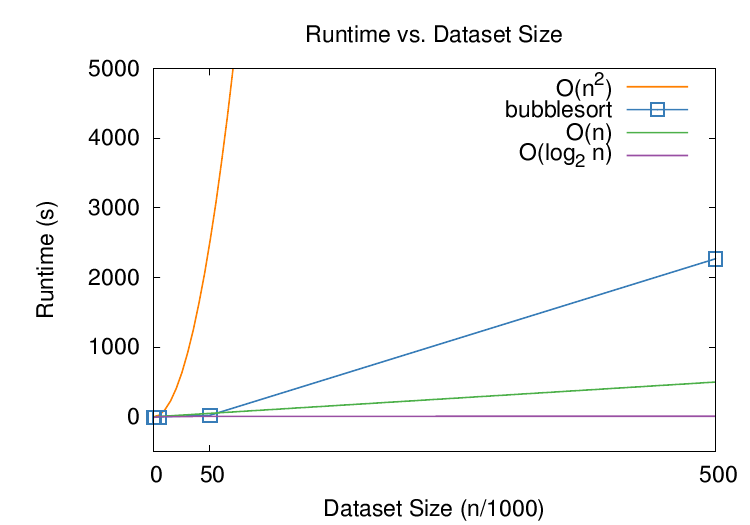
bubblesort.datdata file that contains two columns of numbers: the first column is n, the size of the array, and the second column is t, the time taken to sort the array. - a plot of the
bubblesort.datdata file showing the run time of bubblesort graphically against various other theoretical bounds, e.g., O(n), O(log n), O(n2).
gnuplot to plot the resultant graph. Here is
a gnuplot script (call it plot.plt) that plots
something reasonable:
reset
# this should work but need to add fontpath -- could be system-specific
set fontpath \
  "/sw/share/texmf-dist/fonts/type1!" \
  "/usr/share/texmf/fonts/type1!" \
  "/usr/local/teTeX/share/texmf-dist/fonts/type1!" \
  "/usr/share/texmf-texlive/fonts/type1!"
set term postscript eps enhanced "NimbusSanL-Regu" 22 \
  fontfile "uhvr8a.pfb" fontfile "usyr.pfb" fontfile "utmri8a.pfb"
set xrange [*:*]
set xtics (0,50,500)
set yrange [-500:5000]
set key top right
set title "Runtime vs. Dataset Size"
set ylabel "Runtime (s)"
set xlabel "Dataset Size (n/1000)"
set output 'plot.eps'
plot \
  x**2 title "O(n^2)" \
    with lines lt 1 lw 3 lc rgb "#ff7f00", \
  'bubblesort.dat' using ($1)/1000:($2)/1000 title "bubblesort" \
    with linespoints pt 4 ps 2 lt 1 lw 3 lc rgb "#377eb8",\
  x title "O(n)" \
    with lines lt 1 lw 3 lc rgb "#4daf4a",\
  log10(x)/log10(2) title "O(log_2 n)" \
    with lines lt 1 lw 3 lc rgb "#984ea3"
gnuplot plot.plt
.eps file; convert this to something more useful,
like a PDF plot, via the command
epstopdf --nocompress -o=plot.pdf plot.eps
gnuplot and epstopdf commands
into a plot: target in your Makefile.
Then, rewrite your program to accept the size of array you want as
input argument argv[1] and have it write out the
time to sort to std::cout. This way, you can script
the run (and plot) within the Makefile so that a
run target executes the following:
        ./main 5 >> bubblesort.dat
        ./main 500 >> bubblesort.dat
        ./main 5000 >> bubblesort.dat
        ./main 50000 >> bubblesort.dat
        ./main 500000 >> bubblesort.dat
make main
make run
make plot